Warning: This notebook needs a running kernel to be fully interactive, please run it locally or run it on mybinder.
![]()
Dashboard: Or get a dashboard by rendering this notebook with Voila:
![]()
ipyvolume: 3d bar chart
Make sure you go through the Vaex-jupyter tutorial first.
Following https://ipyvolume.readthedocs.io/en/latest/examples/bars.html we take a similar approach to create a 3d bar chart.
[1]:
import vaex
import numpy as np
import vaex.jupyter.model as vjm
[2]:
import ipyvolume as ipv
import bqplot

class IpyvolumeBarChart:
    def __init__(self, x_axis, y_axis):
        self.x_axis = x_axis
        self.y_axis = y_axis
        self.fig = ipv.figure()
        self.color_scale = bqplot.ColorScale(scheme='Reds', min=0, max=1)
        ipv.style.set_style_dark()
        ipv.style.box_off()
        ipv.style.use({'axes': {'y': {'visible': False}}})
        self.scatter = None

    def _scale_change(self, change):
        self.last1 = self.x_axis.max
        self.last2 = self.fig.scales['x'].max
        self.x_axis.min = self.fig.scales['x'].min
        self.x_axis.max = self.fig.scales['x'].max
        self.y_axis.min = self.fig.scales['z'].min
        self.y_axis.max = self.fig.scales['z'].max

    def __call__(self, da):
        ar = da.data
        assert ar.ndim == 2
        dim_x = da.dims[0]
        dim_y = da.dims[1]

        Nx, Ny = ar.shape
        x0, x1 = da.coords[dim_x].attrs['min'], da.coords[dim_x].attrs['max']
        y0, y1 = da.coords[dim_y].attrs['min'], da.coords[dim_y].attrs['max']
        x = np.linspace(x0, x1, Nx)
        y = np.linspace(y0, y1, Ny)

        X, Y = np.meshgrid(x, y, indexing='ij')
        xf = X.flatten()
        yf = Y.flatten()
        ar = np.log1p(ar)
        zf = ar.flatten().astype('f8')

        self.dx = dx = x[1] - x[0]
        self.dy = dy = y[1] - y[0]
        if self.scatter is None:
            with self.fig:
                self.scatter = ipv.scatter(xf, 0, yf, aux=zf,
                                           color=zf,
                                           marker="box",
                                           size=1,
                                           color_scale=self.color_scale,
                                           size_x_scale=self.fig.scales['x'],
                                           size_y_scale=self.fig.scales['y'],
                                           size_z_scale=self.fig.scales['z'])
            self.scatter.shader_snippets = {'size': 'size_vector.y = SCALE_SIZE_Y(aux_current) - SCALE_SIZE_Y(0.0) ; '}
            # since we see the boxes with negative sizes inside out, we made the material double sided
            self.scatter.material.side = "DoubleSide"
            ipv.xlim(x0, x1)
            ipv.zlim(y0, y1)
            # only start observing now that the limits have been set to avoid an initial re-gridding
            for scale in [self.fig.scales['x'], self.fig.scales['z']]:
                scale.observe(self._scale_change, ['min', 'max'])
        else:
            with self.scatter.hold_sync():
                self.scatter.x = xf
                self.scatter.z = yf
                self.scatter.aux = zf
                self.scatter.color = zf
        # we patch holes by making the boxes larger
        patch = 1.05
        self.scatter.geo_matrix = [dx*patch, 0, 0, 0,   0, 1, 0, 0,   0, 0, dy*patch, 0,  0.0, 0.5, 0, 1]
        self.color_scale.max = zf.max().item()
        with self.fig:
            # make the x and z lim half a 'box' larger
            ipv.xlim(x0, x1)
            ipv.zlim(y0, y1)
            ipv.ylim(0, zf.max() * 1.2)
            ipv.xlabel(dim_x)
            ipv.zlabel(dim_y)
            ipv.ylabel('counts')
# barchart3d = IpyvolumeBarChart(x_axis, y_axis)
[3]:
# x_limits, y_limits = limits = df.limits([df.pickup_longitude, df.pickup_latitude], '95%')

# pre calculated values:
x_limits, y_limits = [-74.37857997, -73.53860359], [40.49456025, 40.91851631]
[4]:
# Data is hosted on S3
# df = vaex.open('s3://vaex/taxi/yellow_taxi_2009_2015_f32.hdf5?anon=true')[:800_000_000]

# Or use the Vaex DataFrame server to do the computations!
df = vaex.open('wss://dataframe.vaex.io/yellow_taxi_2009_2015_f32')

x_axis = vjm.Axis(df=df, expression=df.pickup_longitude, min=x_limits[0], max=x_limits[1])
y_axis = vjm.Axis(df=df, expression=df.pickup_latitude, min=y_limits[0], max=y_limits[1])

barchart3dtaxi = IpyvolumeBarChart(x_axis, y_axis)

# we use `barchart3d` as a callable function
da_view = df.widget.data_array(axes=[x_axis, y_axis], display_function=barchart3dtaxi, shape=400)

# we display the progress bar and possible output (stack traces)
display(da_view)

# and the figure widget, display(barchart3d.fig) would also have worked
with barchart3dtaxi.fig:
    ipv.show()
[5]:
await vaex.jupyter.gather()
Voila-vuetify setup
[6]:
import traitlets
import ipywidgets as widgets
import ipyvuetify as v
from vaex.jupyter.widgets import ContainerCard, Html, LinkList, VuetifyTemplate
[7]:
class SchemeTemplate(VuetifyTemplate):
    value = traitlets.Unicode('Reds').tag(sync=True)
    @traitlets.default('template')
    def _template(self):
         return """
    <v-btn-toggle v-model="value">
      <v-btn :value="'Reds'" text >
          <v-icon color="red">mdi-palette</v-icon>
      </v-btn>
      <v-btn :value="'Blues'" text>
          <v-icon color="blue">mdi-palette</v-icon>
      </v-btn>
    </v-btn-toggle>sdd
        """
scheme_widget = SchemeTemplate()
widgets.jslink((scheme_widget, 'value'), (barchart3dtaxi.color_scale, 'scheme'))
scheme_widget
[8]:
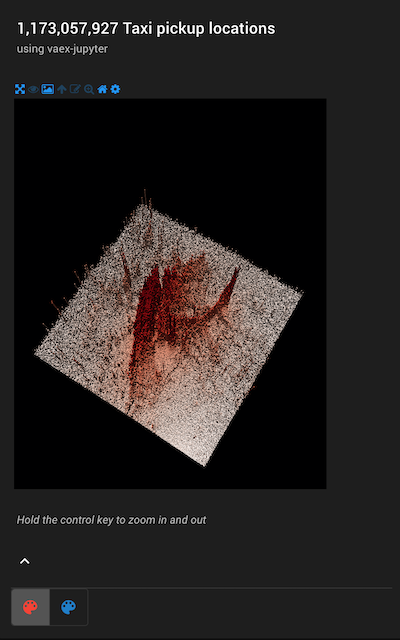
card_widget = ContainerCard(title=f'{len(df):,} Taxi pickup locations',
                            subtitle="using vaex-jupyter",
                            main=barchart3dtaxi.fig,
                            controls=[scheme_widget],
                            show_controls=True,
                            card_props={'style': 'width: 520px;', 'class': 'pa-2 ma-4'},
                            _metadata={'mount_id': 'content-main'},
                            text='<i>Hold the control key to zoom in and out</i>'
                           )
[9]:
# You do not have to render the widget for it to show up in voila-vuetify
card_widget
[11]:
LinkList(items=
    [{'title': 'Vaex', 'url': 'https://vaex.io', 'img': 'https://vaex.io/img/logos/logo-grey.svg', },
     {'title': 'Vaex on GitHub', 'url': 'https://github.com/vaexio/vaex', 'img': 'https://github.githubassets.com/pinned-octocat.svg'},
     {'title': 'Vaex DataFrame server', 'url': 'http://dataframe.vaex.io/', 'icon': 'mdi-database'},
     {'title': 'ipyvolume', 'url': 'https://github.com/maartenbreddels/ipyvolume', 'img': 'https://raw.githubusercontent.com/maartenbreddels/ipyvolume/master/misc/icon.svg'},
     {'title': 'Voila (dashboard)', 'url': 'https://github.com/voila-dashboards/voila', 'icon': 'dashboard'},
     {'title': 'jupyter widgets', 'url': 'https://github.com/jupyter-widgets/ipywidgets', 'icon': 'widgets'},
    ], _metadata={'mount_id': 'content-nav'})
[15]:
v.theme.dark = True
[16]:
Html(tag='span',
     children=['New york taxi dataset with ipyvolume'],
     _metadata={'mount_id': 'content-bar'});

Html(tag='span',
     children=['Resources'],
     _metadata={'mount_id': 'content-title'});