
Data is getting BIG
Some datasets are too large to fit into the main memory of your desktop computer, let alone your laptop. Still, we would like to work with large datasets in the era of Big Data. However, we really don’t want to learn to set up a Hadoop or Spark infrastructure just for a small experiment.
Our dream

Wouldn’t it be great if you could load a 1 Terabyte data file instantly, reading only the parts you need, with a strategy that smart kernel programmers have spent decades optimizing? And while making insane requests, why don’t we ask for an API that feels a bit like pandas, that we all use. Oh yeah, and please don’t use too much memory on my 2013 MacBook Air while you’re at it. Since it’s 2018 and we all work in the Jupyter notebook, make it work with that as well will you? Make sure that all of my open notebooks also share the memory of that dataset as well please.
Wouldn’t it be great if you could load a 1 TB data file instantly.
Making our dream possible
All this is possible with memory mapping, which is a technique where you tell the operating system that you want a piece of memory to be in sync with the content on disk. It is technically quite similar to a swap disk. If a piece of memory isn’t modified, or not used for a while, the kernel will discard it so that RAM can be reused. Also, all processes that have the same file open share the same physical memory.
Memory mapping is excellent, you can memory-map a 1 TB file instantly, and the kernel smartly decides what to read or discard. Now imagine you want to filter out some rows which contain irrelevant data. In pandas, with our 1 TB DataFrame we could do df_filtered = df[df.x > 0], which makes a copy of all the data, taking up another 0.8 TB… well, actually you will see a MemoryError.
Meet vaex

Vaex is a Python library that makes working with such large datasets a breeze. In addition to memory-mapping, it will never touch or copy the data unless explicitly requested. This makes it possible to work with datasets that are the size of your hard drive. Furthermore, it does lazy computations, works with virtual columns, does efficient data cleansing, computes fast N-dimensional statistics, creates interactive visualization and more. So a new file format again I guess? No, we use the good ol’ hdf5 format which is supported by any self-respecting language. Vaex does not really care about the file format, as long as you can memory map the data, you will live long and prosper 🖖.
Apache Arrow

Is hdf5 not new and sexy enough? Ok, we support Apache Arrow which also allows memory mapping and interoperability with other languages.
So… no pandas 🐼?
There are some issues with pandas that the original author Wes McKinney outlines in his insightful blogpost: “Apache Arrow and the “10 Things I Hate About pandas”. Many of these issues will be tackled in the next version of pandas (pandas2?), building on top of Apache Arrow and other libraries. Vaex starts with a clean slate, while keeping the API similar, and is ready to be used today.
Vaex is lazy

Vaex is not just a pandas replacement. Although it has a pandas-like API for column access when executing an expression such asnp.sqrt(ds.x2 + ds.y2), no computations happen. A vaex expression object is created instead, and when printed out it shows some preview values.
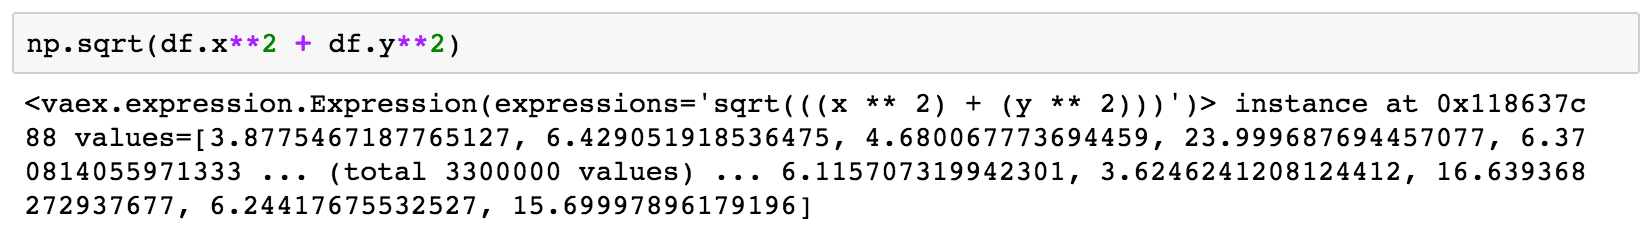 Calling numpy functions with vaex expression leads to a new expression, which delays a computation and saves RAM.
With the expression system, vaex performs calculations only when needed. Also, the data does not need to be local: expressions can be sent over a wire, and statistics can be computed remotely, something that the vaex-server package provides.
Virtual columns
We can also add expressions to a DataFrame, which result in virtual columns. A virtual column behaves like a regular column but occupies no memory. Vaex makes no distinction between real and virtual columns, they are treated on equal footing.
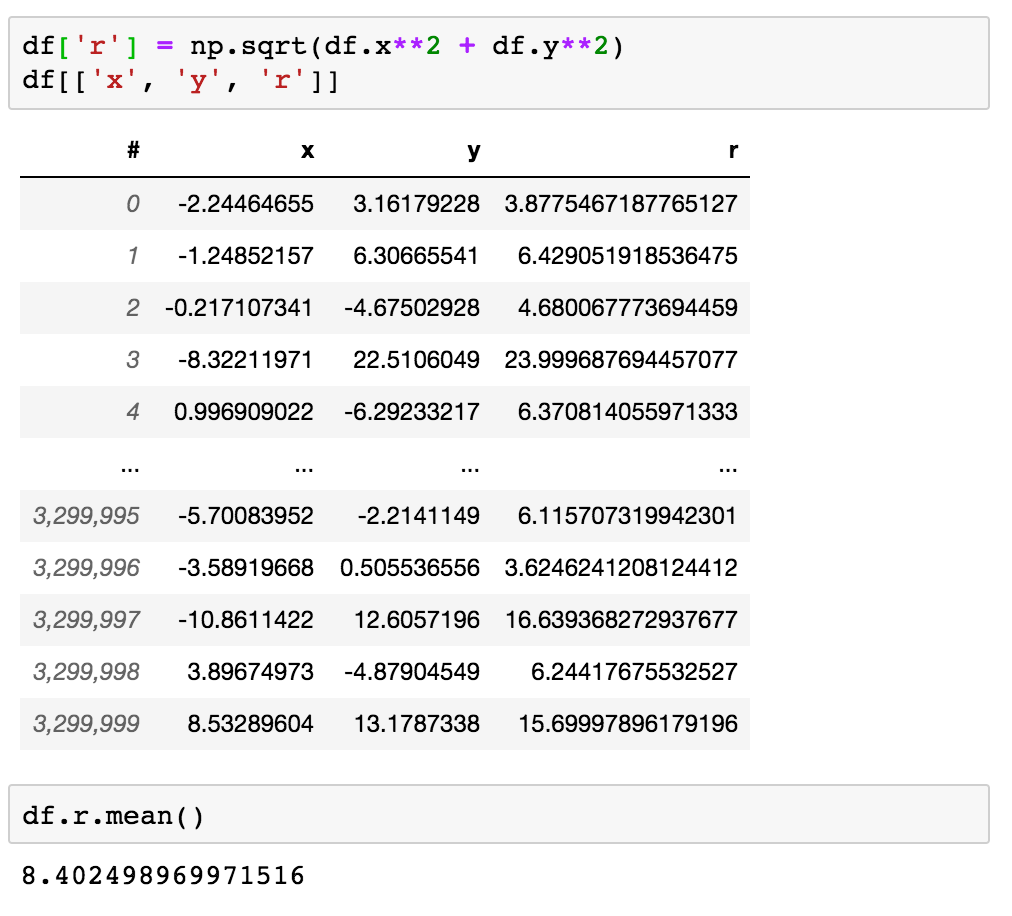 Adding a new virtual column to a DataFrame takes no extra memory.
What if an expression is really expensive to compute on the fly? By using Pythran or Numba, we can optimize the computation using manual Just-In-Time (JIT) compilation.
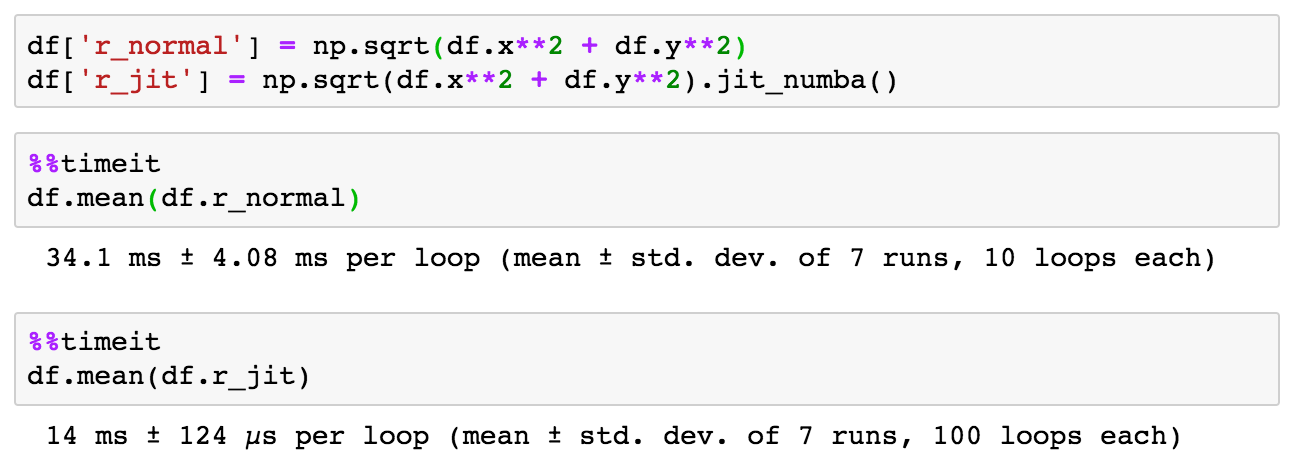 Using Numba or Pythran we can JIT our expression to squeeze out a better performance: > 2x faster in this example.
JIT-ed expressions are even supported for remote DataFrames (the JIT-ing happens at the server).
Got plenty of RAM? Just materialize the column. You can choose to squeeze out extra performance at the cost of RAM.
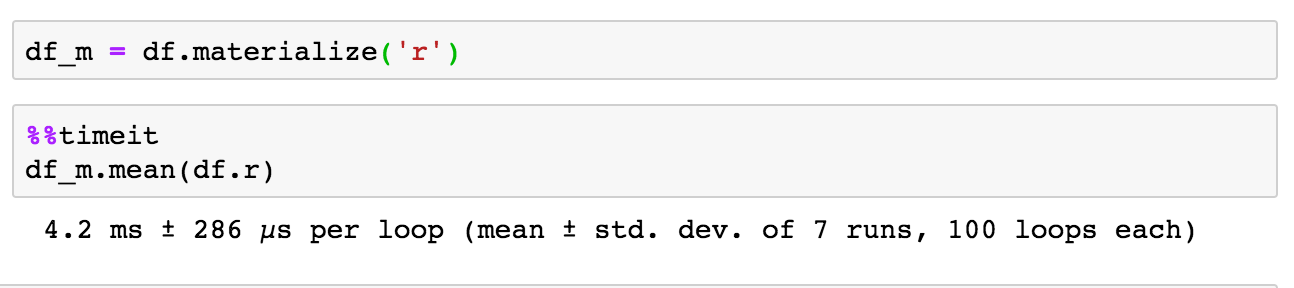 Materializing a column converts a virtual column into an in-memory array. Great for performance (~8x faster), but you need some extra RAM.
Data cleansing

Filtering of a DataFrame, such as ds_filtered = ds[ds.x >0] merely results in a reference to the existing data plus a boolean mask keeping track which rows are selected and which are not. Almost no memory usage, and no memory copying going on.
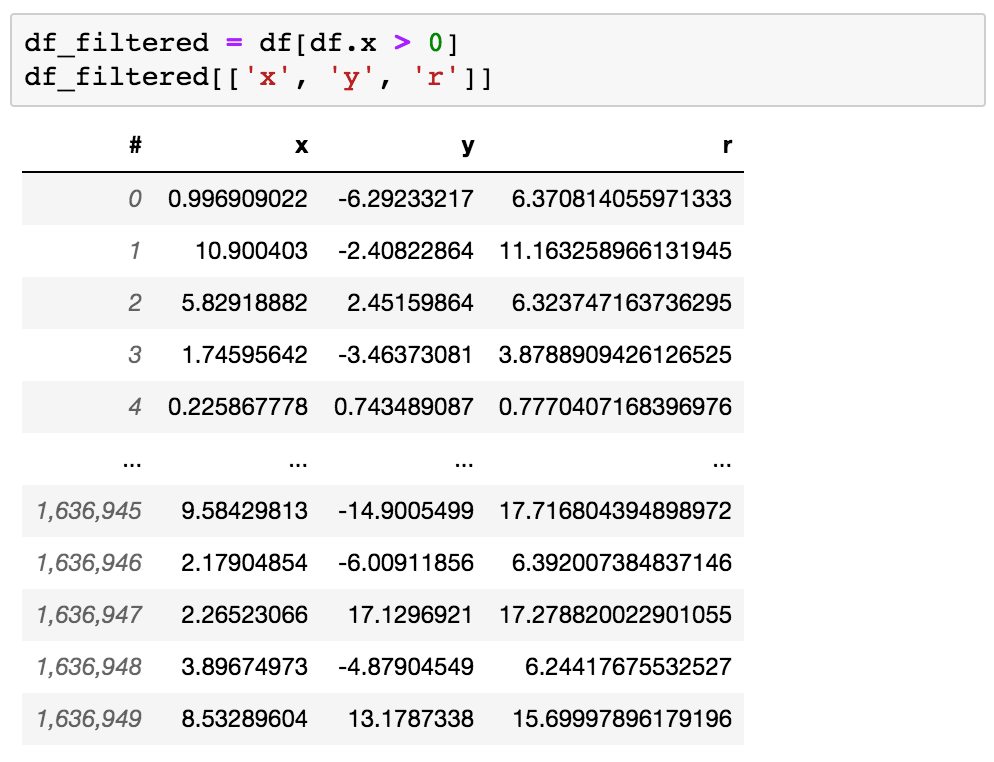 df_filtered has a ‘view’ on the original data. Even when you filter a 1TB file, just a fraction of the file is read.
Almost no memory usage, and no memory copying going on.
Apart from filtering a DataFrame, a selection can also define a subset of the data. With selections, you can calculate statistics for multiple subsets in a single pass over the data. This is excellent for DataFrames that don’t fit into memory (Out-of-core).
 Passing two selections results in two means in a single pass over the data.
Missing values can be a real pain, and is not always easy to decide how to treat them. With vaex, you can easily fill or drop rows of missing values. But here’s the thing: both dropna and fillna methods are implemented via filtering and expressions. This means that, for example, you can try out several fill values at no extra memory cost, no matter the size of your dataset.
 You can try several fill values at virtually no extra memory cost.
Binned Statistics
Vaex is really strong in statistics. Since we are dealing with Big Data, we need an alternative to groupby, something that is computationally much faster. Instead, you can calculate statistics on a regular N-dimensional grid, which is blazing fast. For example, it takes about a second to calculate the mean of a column in regular bins even when the dataset contains a billion rows (yes, 1 billion rows per second!).
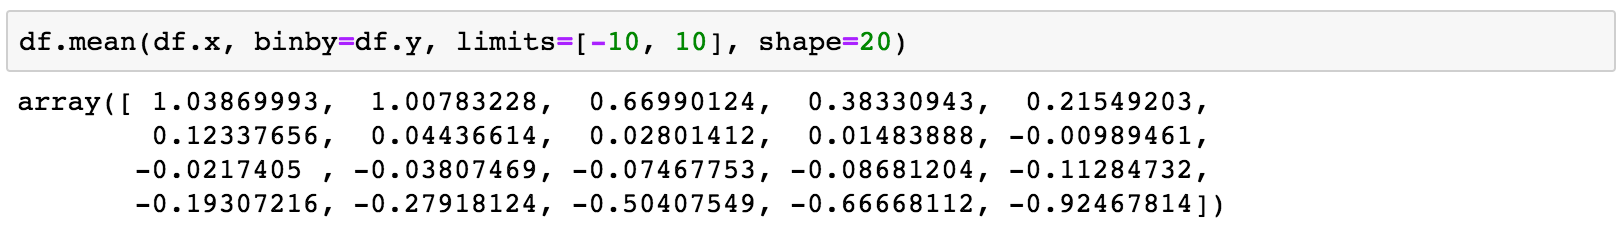 Every statistic method accepts a binby argument to compute statistics on regular Nd array.
yes, 1 billion rows per second!
Visualizations
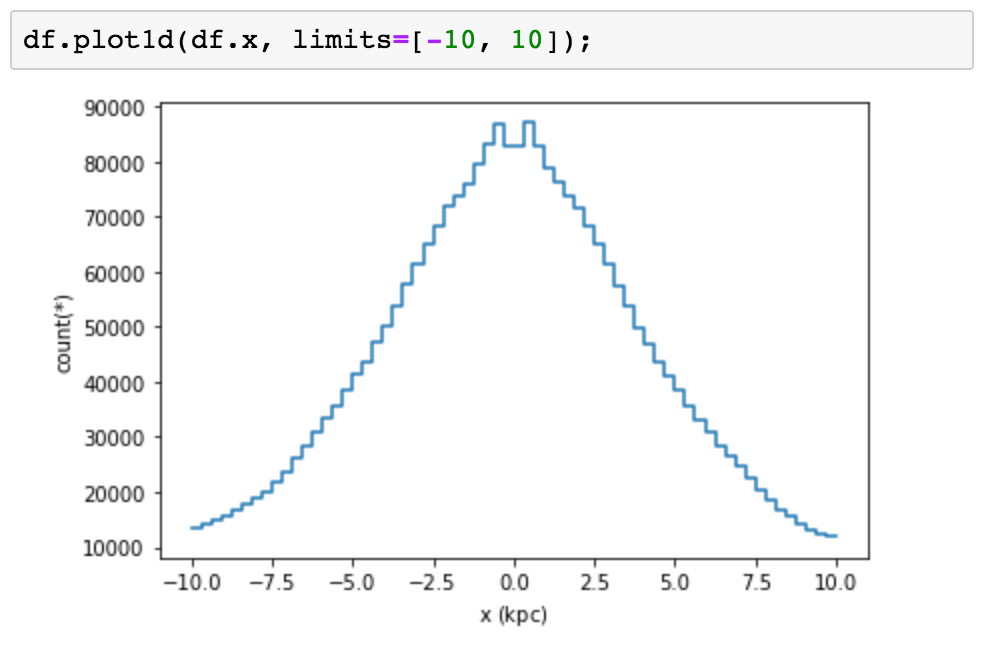
Making meaningful plots and visualizations is the best way to understand your data. But when your DataFrame contains 1 billion rows, making standard scatter plots does not only take a really long time, but results in a meaningless and illegible visualization. You can get much better insights about the structure in your data if you focus on aggregate properties (e.g. counts, sum, mean, median, standard deviation, etc.) of one or more features/columns. When computed in bins, these statistics give a better idea of how the data is distributed. Vaex excels in such computations and the results are easily visualized.
Let’s see some practical examples of these ideas. We can use a histogram to visualize the contents of a single column.
This can be expanded to two dimensions, producing a heat-map. Instead of simply counting the number of samples that fall into each bin, as done in a typical heat-map, we can calculate the mean, take the logarithm of the sum, or just about any custom statistic.

We can even make 3-dimensional volume renderings using ipyvolume.
Since the underlying mechanism for calculating statistics on N-dimensional grids is so fast, we can do them on the fly, and have interactive visualizations (based on bqplot).
 Interactively exploring 150 million taxi trips using vaex+bqplot
More?
Yes, vaex includes a kitchen sink, but it is a modular kitchen sink. Vaex is actually a meta-package, which will install all of the Python packages in the vaex family. Here is a list of the packages:
-
vaex-core: DataFrame and core algorithms, takes numpy arrays as input columns.
-
vaex-hdf5: Provides memory mapped numpy arrays to a vaex DataFrame.
-
vaex-arrow: Similar, but using Apache Arrow.
-
vaex-viz: Visualization based on matplotlib.
-
vaex-jupyter: Interactive visualization based on Jupyter widgets / ipywidgets, bqplot, ipyvolume and ipyleaflet.
-
vaex-astro: Astronomy related transformations and FITS file support.
-
vaex-server: Provides a server to access a DataFrame remotely.
-
vaex-distributed: (Proof of concept) combined multiple servers / cluster into a single DataFrame for distributed computations.
-
vaex-ui: Interactive standalone app/GUI based on Qt.
Want more?
We are constantly working on making vaex better. But that is not all. We are also working really hard on vaex-ml, a package that adds machine learning capabilities to vaex. Some really cool stuff is coming soon, so stay tuned! In the meantime, check out this live demo for a hands-on demonstration of vaex and a preview of vaex-ml.
Learn more about vaex and vaex-ml from our live demo at PyParis 2018
You can also try out the snippets from this article online in a Jupyter notebook using mybinder:
 Click the button to launch a Jupyter notebook to try out the code snippets from the article
Conclusion
Are you ready for Big Tabular Data? We are! The zero memory copy policy, memory mapping, the pandas-like API and the blazing fast computations of statistics on N-dimensional grids makes vaex the go-to Python library for the exploration and analysis of your massive datasets. All this from the comfort of your laptop or PC. Vaex is open source (MIT) and on GitHub, check out its homepage, the documentation, or ask questions on gitter. Try it out and let us know what you think.